
I recently started working on a small robotics project using a Neato XV-11 LIDAR Laser Distance Sensor connected to a computer over UART serial. The goal was to build a Python-based pipeline that could read live LIDAR data, convert it into 2D points, visualize the point cloud, and eventually use the scan data for SLAM.
The project is available on GitHub here: aghilmort/xv11-lidar-slam-viewer
The high-level flow looks like this:
XV11 LIDAR
    ↓
USB Serial / UART
    ↓
Python
    ↓
(x, y) points
    ↓
Matplotlib visualization
For SLAM, the pipeline becomes:
LIDAR scan
    ↓
Scan matching
    ↓
Robot pose estimate
    ↓
Map update
Hardware Setup
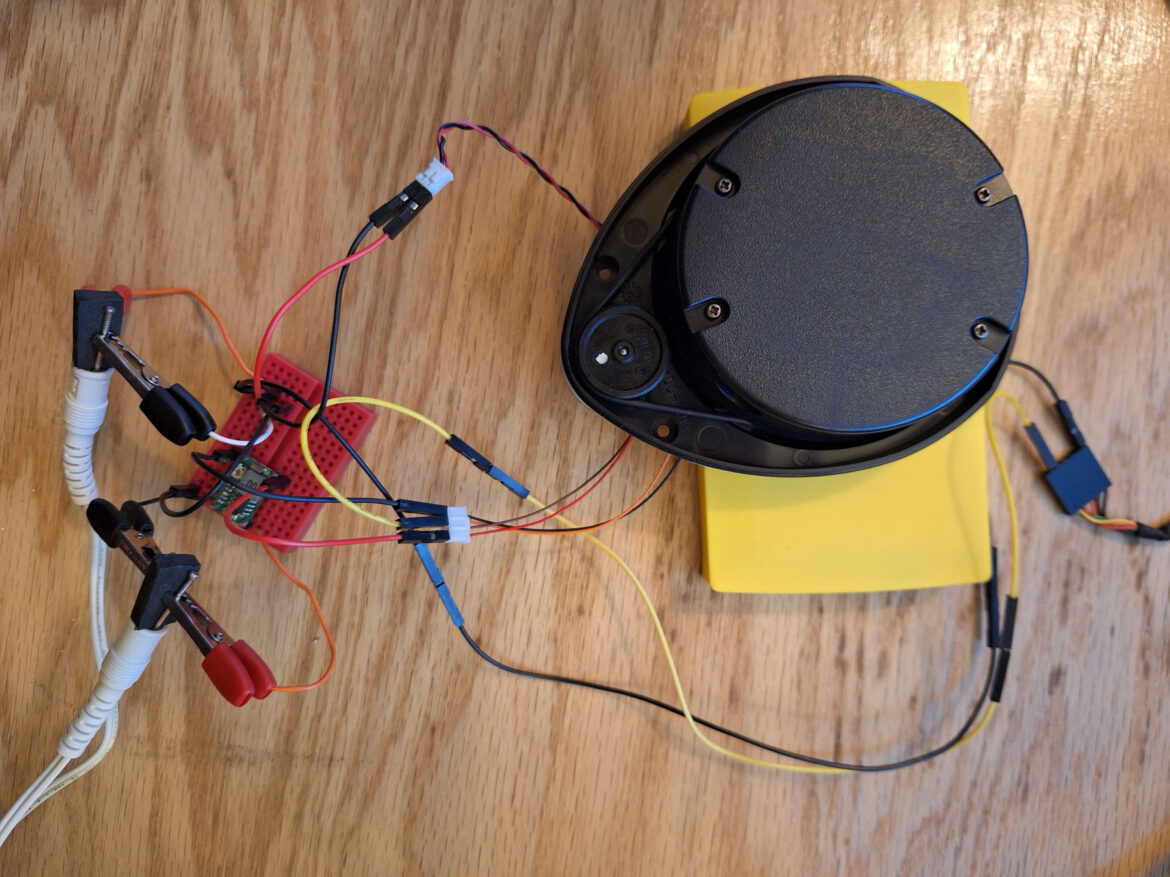
The XV-11 LIDAR sends distance measurements over a serial UART connection. In my setup, the sensor is connected through a USB-to-UART adapter, with a shared ground between the adapter and the LIDAR.
One important detail is that the LIDAR motor must be powered separately and spin steadily. The UART connection is only for reading data; it does not necessarily control the motor speed unless your hardware exposes that separately.
Project Structure
I organized the project into a few focused Python modules:
lidar.py     Reads XV11 packets from UART
slam.py      Runs BreezySLAM
map.py       Handles occupancy grid conversion
viewer.py    Displays live point cloud and map
main.py      Command-line entry point
This structure keeps the project easy to debug. For example, I can run the point cloud viewer first to confirm the sensor is working before introducing SLAM.
Reading XV-11 Packets
The XV-11 sends data in packets. Each packet contains a group of distance readings, and a full revolution gives 360 distance samples.
The lidar.py module handles:
- Opening the serial port
- Synchronizing on packet start bytes
- Validating packet checksums
- Extracting distance and intensity values
- Producing a normalized 360-degree scan
The output of this module is a scan object containing distances in millimeters, validity flags, intensity values, and estimated RPM.
Visualizing the Point Cloud
Before attempting SLAM, I wanted to verify that the LIDAR was producing useful data. The point cloud mode converts polar measurements into Cartesian coordinates:
x = distance * cos(angle)
y = distance * sin(angle)
These points are then plotted live using Matplotlib.
Running the viewer looks like this:
python main.py --port COM3 --mode pointcloud --debug-lidarThe debug flag prints useful serial counters such as packets received, completed scans, checksum failures, and timeout count. This made it much easier to diagnose wiring, baud rate, and packet parsing issues.
Adding SLAM
For SLAM, the project is designed around BreezySLAM. The idea is to feed each complete 360-degree scan into the SLAM algorithm, which performs scan matching and updates an occupancy grid map.
The SLAM flow is:
LIDAR Scan → BreezySLAM → Pose Estimate → Occupancy GridThe robot pose includes:
xpositionyposition- heading angle
The map is displayed alongside the live point cloud, making it easier to see both the raw sensor data and the estimated environment.
Dependency Notes
The point cloud viewer only needs:
pyserial
numpy
matplotlib
BreezySLAM is a little more complicated because it is not always available as a normal Python wheel, especially on Windows. For that reason, I separated the dependencies:
pip install -r requirements.txtfor point-cloud mode, and:
pip install -r requirements-slam.txtfor SLAM mode.
If BreezySLAM fails to build on Windows, using WSL or Linux may be easier.
Lessons Learned
The most useful debugging step was separating point cloud visualization from SLAM. If the point cloud does not work, SLAM will not work either.
A few important checks:
- Is the correct COM port selected?
- Is the baud rate correct?
- Is the LIDAR motor spinning steadily?
- Are packets arriving?
- Are checksums passing?
- Are full scans being completed?
Once the point cloud is stable, SLAM becomes a tuning problem instead of a mystery.
Next Steps
The next improvements I want to make are:
- Add motor speed monitoring and control
- Record scans to a file for offline testing
- Add odometry input from the robot base
- Improve map saving and replay tools
- Tune SLAM parameters for indoor navigation
This project is a good starting point for learning how raw LIDAR data becomes a live map. It also shows why robotics software is often built in layers: first read the sensor, then visualize it, then localize, then map, and only then start making navigation decisions.
Leave a Reply