In 2014, this project set out to answer a deceptively simple question: what would a real-time home monitoring system look like if it did more than place a static camera in a corner?
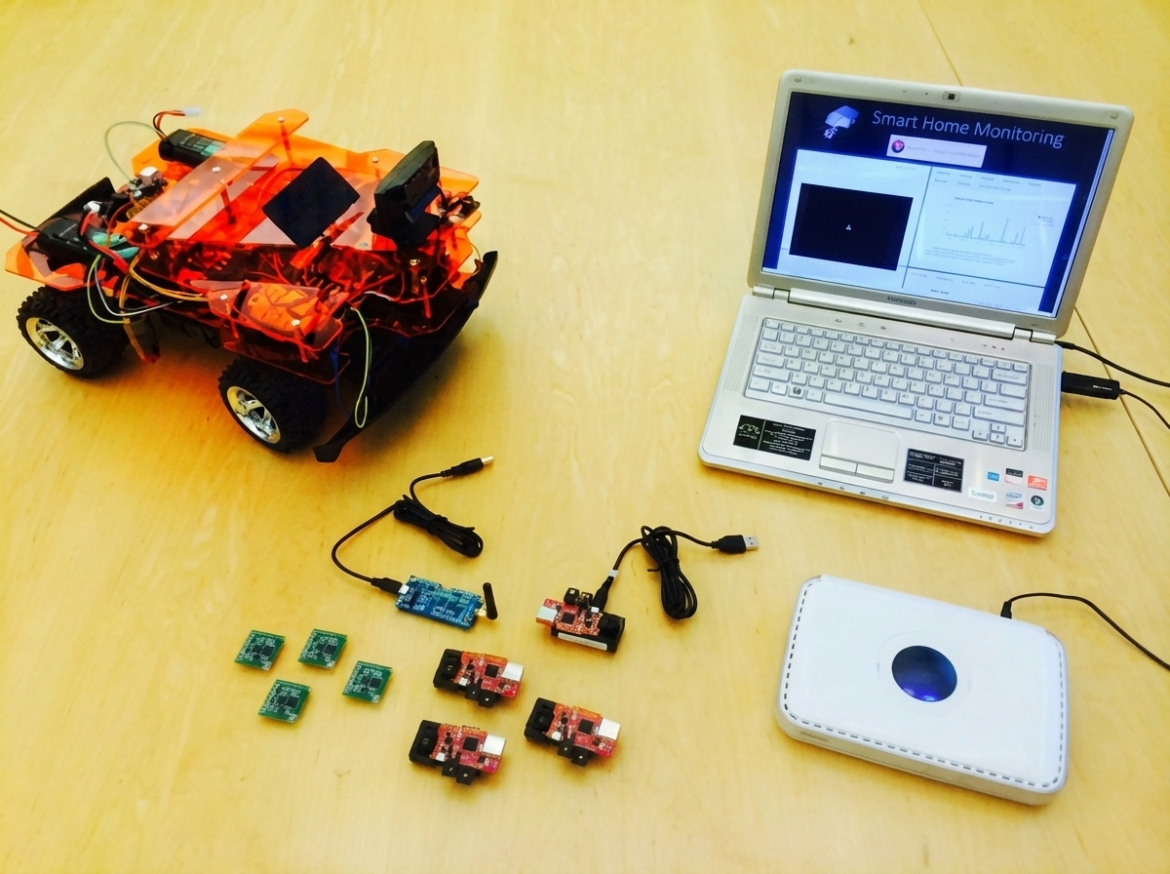
The result was a hybrid prototype that combined four very different subsystems:
- A wireless sensor network built from Zolertia Z1 motes running Contiki.
- An active RFID subsystem for tracking valuable items.
- A BeagleBone Black robot with Wi-Fi video streaming and motor control.
- A centralized management server with Java data collection, MySQL storage, and a PHP/JavaScript web dashboard.
The interesting part was not any one technology by itself. It was the glue. The system had to move data from tiny embedded devices, serial readers, and a mobile Linux board into a single interface a remote user could understand.
The Problem
Traditional home security systems are good at a narrow job: detect an event, sound an alarm, maybe call someone. This project aimed for something broader: remote awareness.
If a homeowner is away, the system should help answer questions like:
- What is the current temperature or power-related state reported by sensors?
- Are tagged valuable items still nearby?
- Can I inspect a part of the home that fixed cameras cannot see?
- Can the system record events and readings over time?
That pushed the design toward a heterogeneous network. Low-power sensor nodes handled periodic environmental data. RFID tags handled object presence. Wi-Fi handled higher-bandwidth robot communication and video. A server stitched those channels together.
Architecture
The system consists of four main pieces: the centralized management server, the robot, the wireless sensor network, and the RFID subsystem. The diagrams below show the intended relationship between the user interface, Java server components, Wi-Fi robot path, WSN, and RFID network.


The server was the center of gravity. It ran:
- Apache and PHP for the web interface.
- MySQL for persisted readings.
- Java applications for collecting WSN and RFID data.
- Collect-view, adapted from the Contiki ecosystem, for sensor network visualization and ingestion.
The hardware stack was equally mixed. The WSN used Zolertia Z1 nodes with MSP430 microcontrollers and IEEE 802.15.4 radios. The robot used a BeagleBone Black, a Wi-Fi dongle, a Logitech webcam, motors, batteries, and a Z1 node mounted on the robot so it could participate in the sensor network too.
That last part is what made the prototype more than a dashboard. The mobile robot could theoretically turn sensor readings into inspection missions: move toward an area, gather local data, stream video, and return to a charging location.
Sensor Data: From Contiki Nodes to the Server
The WSN went through several design iterations. The final path used RPL for IPv6 routing in a low-power network, with UDP senders on regular nodes and a UDP sink at the gateway.
On each sending node, the code gathered network metadata, built a Collect-view message, and sent it to the server address over UDP:
void
collect_common_send(void)
{
  static uint8_t seqno;
  struct {
    uint8_t seqno;
    uint8_t for_alignment;
    struct collect_view_data_msg msg;
  } msg;

  uint16_t parent_etx;
  uint16_t rtmetric;
  uint16_t num_neighbors;
  uint16_t beacon_interval;
  rpl_parent_t *preferred_parent;
  linkaddr_t parent;
  rpl_dag_t *dag;

  if(client_conn == NULL) {
    return;
  }

  memset(&msg, 0, sizeof(msg));
  seqno++;
  if(seqno == 0) {
    seqno = 128;
  }
  msg.seqno = seqno;

  linkaddr_copy(&parent, &linkaddr_null);
  parent_etx = 0;

  dag = rpl_get_any_dag();
  if(dag != NULL) {
    preferred_parent = dag->preferred_parent;
    rtmetric = dag->rank;
    beacon_interval = (uint16_t) ((2L << dag->instance->dio_intcurrent) / 1000);
    num_neighbors = uip_ds6_nbr_num();
  } else {
    rtmetric = 0;
    beacon_interval = 0;
    num_neighbors = 0;
  }

  collect_view_construct_message(&msg.msg, &parent,
                                 parent_etx, rtmetric,
                                 num_neighbors, beacon_interval);

  uip_udp_packet_sendto(client_conn, &msg, sizeof(msg),
                        &server_ipaddr, UIP_HTONS(UDP_SERVER_PORT));
}
Source: ProjectCode/NodeCode/ipv6/rpl-collect/udp-sender.c
The gateway node acted as the RPL root and UDP sink. Once packets arrived, it passed the payload into the Collect-view receive path:
static void
tcpip_handler(void)
{
  uint8_t *appdata;
  linkaddr_t sender;
  uint8_t seqno;
  uint8_t hops;

  if(uip_newdata()) {
    appdata = (uint8_t *)uip_appdata;
    sender.u8[0] = UIP_IP_BUF->srcipaddr.u8[15];
    sender.u8[1] = UIP_IP_BUF->srcipaddr.u8[14];
    seqno = *appdata;
    hops = uip_ds6_if.cur_hop_limit - UIP_IP_BUF->ttl + 1;
    collect_common_recv(&sender, seqno, hops,
                        appdata + 2, uip_datalen() - 2);
  }
}
Source: ProjectCode/NodeCode/ipv6/rpl-collect/udp-sink.c
This is one of the places where the project feels very much like a real systems integration effort. The network was not only sending temperature values. It was also reporting topology health: preferred parents, route metrics, neighbor counts, beacon intervals, hop counts, and sequence numbers. Those details are exactly what you need when debugging a low-power multi-hop network.
Persisting WSN and RFID Readings
Once sensor data reached the Java server application, temperature and average power readings were written into MySQL:
preparedStatement = connect
  .prepareStatement("insert into home_monitoring.wsn (NODE_ID, SENSOR_ID, SENSOR_VAL) values (?, ?, ?)");

preparedStatement.setString(1, sensorData.getNodeID());
preparedStatement.setString(2, "T");
preparedStatement.setDouble(3, Math.round(sensorData.getTemperature() * 100.0) / 100.0);
preparedStatement.executeUpdate();

preparedStatement = connect
  .prepareStatement("insert into home_monitoring.wsn (NODE_ID, SENSOR_ID, SENSOR_VAL) values (?, ?, ?)");

preparedStatement.setString(1, sensorData.getNodeID());
preparedStatement.setString(2, "B");
preparedStatement.setDouble(3, Math.round(sensorData.getAveragePower() * 100.0) / 100.0);
preparedStatement.executeUpdate();
Source: ProjectCode/ServerCode/JavaDesktopApplication/CollectView/src/se/sics/contiki/collect/CollectServer.java
The database schema separated WSN readings, RFID readings, event logs, location mappings, and mission scheduling:
CREATE TABLE IF NOT EXISTS `wsn` (
  `ID` int(10) unsigned NOT NULL AUTO_INCREMENT,
  `TIMESTAMP` timestamp NOT NULL DEFAULT CURRENT_TIMESTAMP,
  `NODE_ID` varchar(11) NOT NULL,
  `SENSOR_ID` varchar(2) NOT NULL,
  `SENSOR_VAL` double NOT NULL,
  PRIMARY KEY (`ID`)
) ENGINE=InnoDB DEFAULT CHARSET=latin1 COMMENT='WSN Subsystem Readings';

CREATE TABLE IF NOT EXISTS `rfid` (
  `ID` int(10) unsigned NOT NULL AUTO_INCREMENT,
  `TIMESTAMP` timestamp NOT NULL DEFAULT CURRENT_TIMESTAMP,
  `TAG_ID` int(10) unsigned NOT NULL,
  `PREV_RSSI` int(10) unsigned DEFAULT NULL,
  `CURR_RSSI` int(10) unsigned NOT NULL,
  PRIMARY KEY (`ID`)
) ENGINE=InnoDB DEFAULT CHARSET=latin1 COMMENT='RFID Subsystem Readings';
Source: ProjectCode/Database/home_monitoring.sql
The RFID side used an active TagSense reader over serial. A Java Reader class listened on the COM port, parsed incoming packets, extracted the tag ID and RSSI, and periodically inserted the readings:
String scannedInput = readBuffer.toString();
RSSI = scannedInput.substring(scannedInput.length() - 2, scannedInput.length());
Integer RSSI_val = Integer.parseInt(RSSI, 16);

insertCount++;
if(insertCount % 25 == 0) {
  Class.forName("com.mysql.jdbc.Driver");
  connect = DriverManager
    .getConnection("jdbc:mysql://localhost:3306/home_monitoring?"
      + "user=root&password=<redacted>");

  preparedStatement = connect
    .prepareStatement("insert into home_monitoring.rfid (TAG_ID, CURR_RSSI) values (?, ?)");

  preparedStatement.setInt(1, Integer.parseInt(scannedInput.substring(6, 10)));
  preparedStatement.setInt(2, RSSI_val);
  preparedStatement.executeUpdate();
}
Source: ProjectCode/ServerCode/JavaDesktopApplication/CollectView/src/se/sics/contiki/collect/Reader.java
This gave the system two complementary signals: sensor nodes could describe environmental conditions, while RFID RSSI could suggest whether tagged items were still in range.
The Web Dashboard
The web layer was a pragmatic PHP and JavaScript interface. The browser periodically requested data for each node or tag, then used Google Charts to render time-series views.
var interval = 7500;

var deviceInfo_N1_T = {deviceType: 'Sensor', deviceID: '1.0', deviceSubID: 'T'};
var divID_N1_T = 'chart_div_N-1-T';

var deviceInfo_T1 = {deviceType: 'Tag', deviceID: '1'};
var divID_T1 = 'chart_div_T-1';

getLiveData(deviceInfo_N1_T, divID_N1_T);
getLiveData(deviceInfo_T1, divID_T1);

setInterval(function(){ getLiveData(deviceInfo_N1_T, divID_N1_T); }, interval);
setInterval(function(){ getLiveData(deviceInfo_T1, divID_T1); }, interval);
Source: ProjectCode/ServerCode/WebInterface/HomeMonitoring/index.php
The PHP endpoint returned JSON in the format expected by Google Visualization:
switch($_POST['deviceType']){
    case 'Sensor':
        $pulledData = $mysqli->query(
            "SELECT TIMESTAMP,SENSOR_VAL FROM wsn WHERE NODE_ID='".$_POST['deviceID']."'
             AND SENSOR_ID='".$_POST['deviceSubID']."' ORDER BY TIMESTAMP ASC"
        );
        break;
    case 'Tag':
        $pulledData = $mysqli->query(
            "SELECT TIMESTAMP,CURR_RSSI FROM rfid WHERE TAG_ID='".$_POST['deviceID']."'
             ORDER BY TIMESTAMP ASC"
        );
        break;
}

$dataTable = '{
  "cols": [{"id":"","label":"Time","pattern":"","type":"string"},';

while ($row = $pulledData->fetch_assoc()) {
    switch($_POST['deviceType']){
        case 'Sensor':
            $value = $row['SENSOR_VAL'];
            break;
        case 'Tag':
            $value = $row['CURR_RSSI'];
            break;
    }

    $dataTable .= '{"c":[{"v":"'.$row['TIMESTAMP'].'","f":null},{"v":'.$value.',"f":null}]},';
}

echo $dataTable;
Source: ProjectCode/ServerCode/WebInterface/HomeMonitoring/getLiveData.php
Looking at this now, the implementation has obvious 2014-era rough edges: synchronous AJAX, hand-built JSON, direct string interpolation into SQL, and hard-coded device IDs. But the architectural idea is still clear: normalize data from heterogeneous devices into a database, then expose it through a simple web interface.
The Robot and the BeagleBone Black
The robot subsystem was the most ambitious part. It was intended to provide on-demand inspection in areas that static cameras could not cover. There were two modes: manual control through the web interface and autonomous operation.
The BeagleBone Black was chosen because it could sit between embedded control and Linux networking. It had enough compute for camera streaming, enough I/O for motors and sensors, and could connect to a home-style Wi-Fi network.
For video, the project used a BeagleBone webcam/OpenCV codebase and streamed H.264 camera output over RTP:
v4l2-ctl --set-fmt-video=width=1920,height=1080,pixelformat=1

./capture -F -o -c0 | avconv -re -i - -vcodec copy -f rtp rtp://192.168.1.4:1234/
Source: ProjectCode/BBBCode/boneCV/streamVideoRTP
For motion control, a Bonescript program drove two output pins and used a potentiometer reading as crude position feedback:
var b = require('bonescript');

var SERVO_OUT_1 = 'P9_30';
var SERVO_OUT_2 = 'P9_31';
var POT_IN = 'P9_40';

var position = 0;
var zeroPosition = 0.5;

function moveRight(){
  b.digitalWrite(SERVO_OUT_1, b.HIGH);
  b.digitalWrite(SERVO_OUT_2, b.LOW);
}

function moveLeft(){
  b.digitalWrite(SERVO_OUT_1, b.LOW);
  b.digitalWrite(SERVO_OUT_2, b.HIGH);
}

function savePosition(x){
  position = (x.value - 0.37) / (0.62 - 0.37);
  console.log('Current Position = ' + position);
}
Source: ServoCode/Servo_code_new.txt
This split was practical. Tiny sensor nodes were not a good fit for video. The BeagleBone could handle the webcam path over Wi-Fi, while the Z1 node on the robot kept the robot connected to the WSN side of the system.
What Worked
The project successfully demonstrated a full-stack prototype across several communication domains:
- Z1 motes formed a Contiki/RPL sensor network.
- A gateway node connected the WSN to the management server.
- RFID tags reported object-presence signals through a USB reader.
- A Java desktop application collected and persisted readings.
- A PHP web UI visualized sensor and RFID data.
- A BeagleBone-based robot handled camera streaming and motion control experiments.
The most important design win was treating the home as a set of cooperating networks rather than one monolithic network. Low-power WSN devices, RFID tags, Wi-Fi video, and web software all have different constraints. The system let each technology do the job it was good at.
What Was Hard
This wasn’t without integration pain. The hard parts were not limited to algorithms. They included:
- Serial-port detection and tooling differences on Windows.
- Power instability, especially when battery voltage dropped and hardware behaved unpredictably.
- Configuring Wi-Fi on the BeagleBone in a campus-network environment.
- Bridging Contiki/6LoWPAN networking with Java desktop tooling.
- Managing interference and coexistence between multiple wireless systems.
- Balancing what should run on low-power motes versus the BeagleBone.
That last tradeoff is the heart of many embedded systems. The original idea was to push more robot communication through the WSN. In practice, video pushed the design toward Wi-Fi and the BeagleBone. That is not a failure of the concept; it is the system discovering its real constraints.
What I Would Change Today
If I were modernizing this prototype now, I would keep the hybrid architecture but change the implementation choices:
- Replace direct PHP/MySQL string queries with a small authenticated API.
- Use MQTT or another message broker between devices and the server.
- Store time-series readings in a schema designed for telemetry.
- Move secrets out of source code and into environment configuration.
- Replace hard-coded node lists with device registration.
- Use WebSockets or server-sent events instead of polling every chart independently.
- Add alert rules: tag missing, temperature above threshold, node offline, robot battery low.
- Add an event timeline so raw telemetry becomes human-readable history.
The biggest product change would be to make “state” first-class. Instead of showing only charts, the dashboard should answer: Is the home okay right now? What changed recently? What should I inspect?
Why This Project Is Still Interesting
This prototype sits at a useful point in the evolution of connected-home systems. It predates the current wave of commodity smart-home platforms, but it already contains many of the same concerns:
- Edge devices with limited power.
- Multiple radio technologies.
- Local gateways.
- Remote dashboards.
- Video as a high-bandwidth exception.
- Automation ideas that depend on reliable sensing.
It is also a reminder that “IoT” is mostly integration work. The exciting demo is a web page showing live data. The real engineering is everything underneath it: routing, serial parsing, packet formats, power management, database design, and careful debugging across devices that fail in very different ways.
The project did not just build a smart home interface. It built a small laboratory for asking how homes could become observable, inspectable, and eventually adaptive.
Leave a Reply